Do you use visual content in your content marketing? If not, your content is unlikely to stand out.
According to Hubspot, 70% of companies invest in content marketing that uses visual marketing strategies. A large proportion of marketers are giving importance to visual content because it makes content unique and sets it apart from competitors.
Not only marketers but readers also like visual information and respond better to visual content than plain text because visual content makes it easy and effortless for readers to understand the content while text-only content takes more effort and concentration to read.
Other reasons why marketers should use visual communication are that it can grab immediate people’s attention and drive engagement despite the fact that they might have many articles before reading your article and their minds are already full of information.
So, using visuals in your content can be crucial for you as a marketer. But what type of visual content should you use in your content marketing?
In this post, you’ll get to know:
- 10 Types Of Visual Content That Can Drive The Maximum Engagement
- Why Do Visuals Increase Engagement?
10 Types Of Visual Content That Can Drive The Maximum Engagement
1. Infographics
As the name suggests an infographic is made of “information” and “graphics”, it is used by marketers to deliver the information in the best way with help of the graphics.
The best thing about infographics is that you can grab the attention of people without compromising on the amount of information delivered, you can load it with both text and graphics. That’s why, Infographics are liked and shared 3X more than any other type of visual material available.
You can use an infographic for any type of blog post whether it’s a survey, a list post, a how-to guide, a step-by-step process, or a recipe.
I’ll try and give you a description of what makes a great infographic. This, for example, is an infographic from one of Helplama’s surveys – How consumers perceive app push notifications.
So the main thing to note in this infographic is that it successfully grabs the attention of people and also shares all the relevant information and stats that we wanted to share with the readers.
So, your infographic should be concise in its usage of text. Use too much text and you risk putting people off. And, it should use a variation in font sizes to highlight the most important/interesting bits.
How to create an infographic? You don’t need high designing knowledge or experience to create infographics, having a creative mind is enough. Free online software like Canva consists of thousands of free templates and elements that you can use to create infographics for your content.
2. Gifographics
A gifographic equals GIF, info, and graphics. In simple words, gifographics is the animated version of infographics. GIF stands for Graphics Interchange Format, moving images that you must have seen on social media, and you also might be using them while having conversations or while posting on social platforms.
Here’s a great example of how a good gifographic can be used.

Facebook and Instagram don’t allow users to upload a GIF externally on the networks, but they allow users to use the GIFs provided by Giphy. That means you can’t upload a gifographic on Facebook and Instagram. But thankfully, Twitter allows its users to upload GIFs externally, so you can upload and share gifographics with your target audience on Twitter.
Gifographics are not very much popular in the content marketing world, maybe because of the skill and effort required for creating them. And that can be a good thing for you to set your content apart from the content of your competitors.
How to create a gifographic? Creating a gifographic is not as easy as creating a normal GIF! For creating a gifographic, one should have knowledge and experience of motion graphics or you need to hire a graphic designer.
Also read: 8 Best Content Protector Apps For Shopify
3. Data-driven Graphs
Graphs are mostly used to show and present comparative or statistical data efficiently. Using graphs to grab user attention and increase user engagement is a must when your content is backed up with statistical data.
Graphs make it easy for people to understand and remember the information and share the data with others.
Here’s a good example of using graphs to present data or content:
In our Twitter engagement survey, we discovered that 69% of consumers expect the company (they complained about on Twitter) to read their tweets.
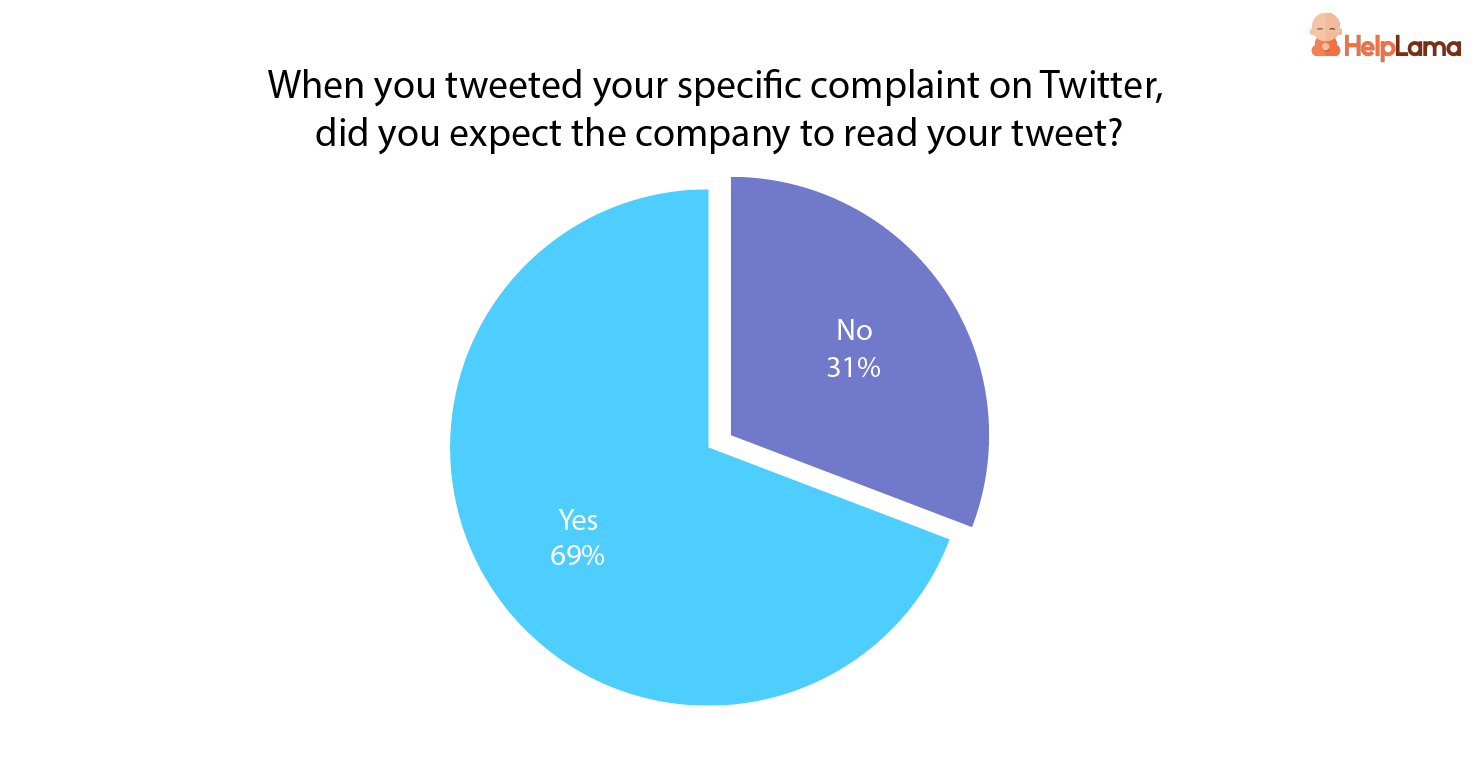
Instead of just writing the stat, we also added a pie-chart in the article, making the data more attractive, engaging, and shareable. According to Quicksprout’s study, Graphical images are the fourth most shareable images on social media, which means adding graphs can attract more links and can ultimately boost your traffic and SEO rankings.
Note: You can share someone else’s research or secondary data in your post, data doesn’t need to be original or created by you, just make sure you attribute the original source.
If you are writing on original research or survey done by you, then don’t forget to add your brand or website’s logo to the graphs. This can help to build a good brand image, awareness, and credibility.
How to create a graphical image? You can create a graph with most of the basic or designing software – Google sheets, Canva, or Apple’s Numbers if you’re using a Mac. The above graph was created with Apple’s Numbers software.
4. Pictures
The time is long gone when marketers used to pitch text-only content to their audience, now an article seems incomplete without pictures.
Pictures are mainly of two types – original and stock, both can be useful based on your content. Original pictures clicked by you can explain your intent and add value to your content, better than any other visual content.
Original or stock, you should definitely use images. Why?
Because pictures make your content more memorable. As per Brainrules’ study, after three days of hearing a piece of information, people only remember 10% of it while they remember 65% of information if they see a relevant picture along with content.

But a picture should be relevant to your content. Content marketers often don’t spend time on creating or finding relevant and useful pictures. It can take some time to find relevant pictures but it will add value to your content and help your audience to have a better understanding of the content or information. They can also make your content more memorable, attractive, and shareable.
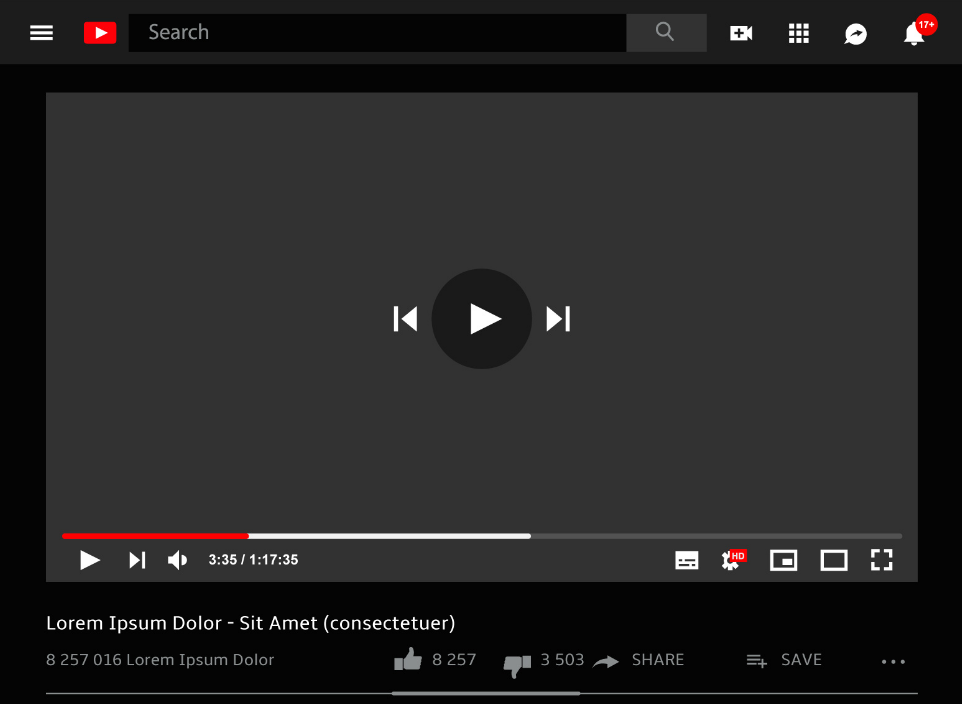
5. Videos
According to Hubspot, the most used media in content marketing is Video and 58% of consumers want to see more videos from the brands or companies they follow or support.
As video is the primary media used for content marketing, it becomes crucial for you to use videos in your content to face the cut-throat competition.
Content marketers like videos more than any other content because a video takes very little time to transfer the information and message compared to the textual content, and time is very precious.
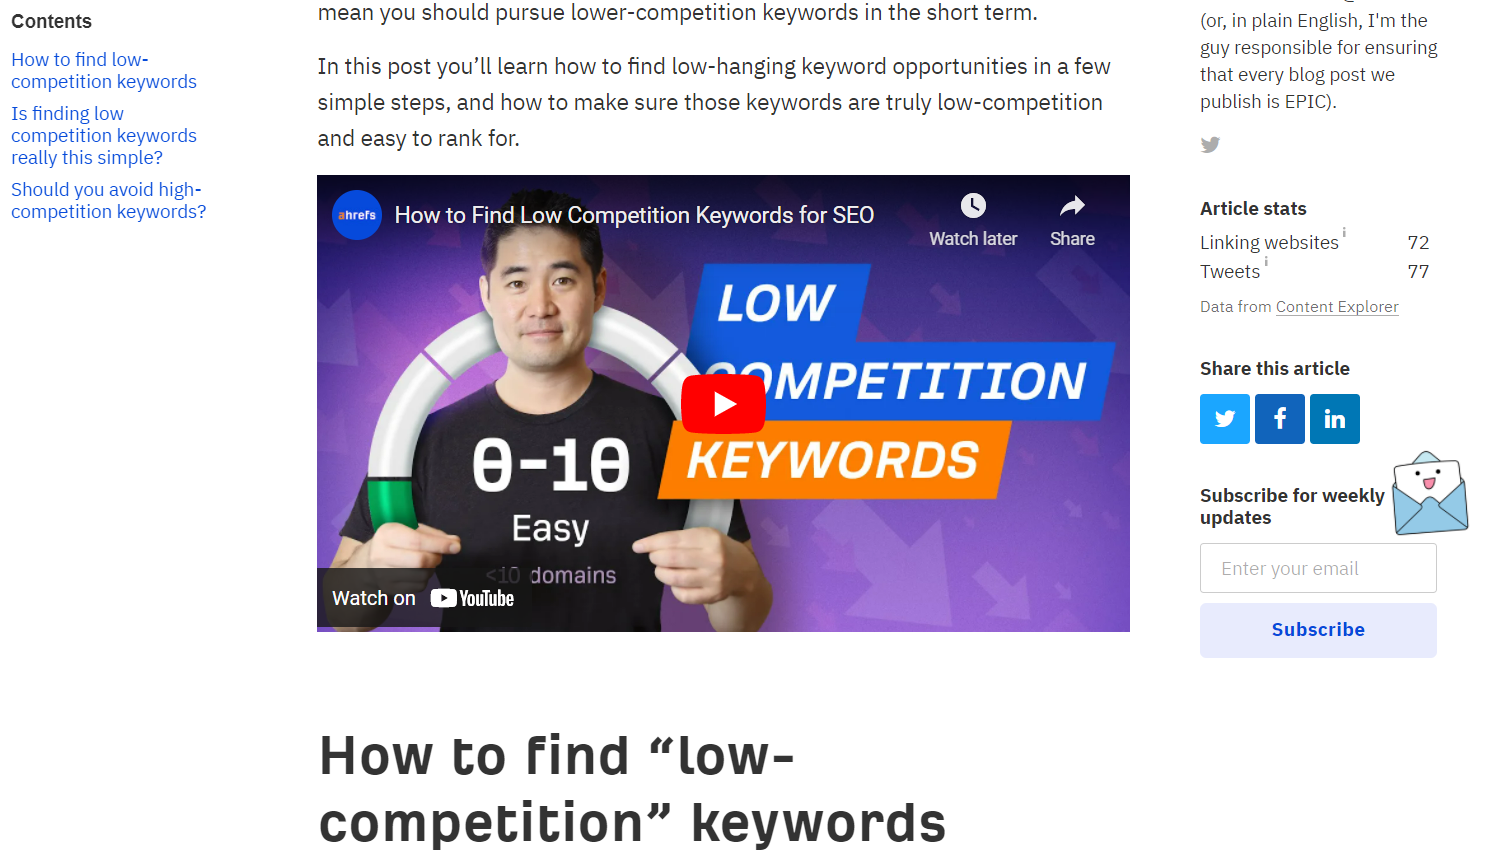
I am not saying that you should cover all your content in videos but you should use videos along with textual content. Embedding videos in blog posts have also become popular, below is a screenshot of Ahrefs blog where they have embedded a youtube video in their blog post about low competition keywords.
Along with making your content more appealing and useful, using videos in blog posts can also have a positive impact on user’s minds that you’re not just a website or blog, and can help you build a brand image.
Furthermore, according to Google, 7 out of 10 people watch YouTube videos to get a solution regarding their job, studies, or hobbies.
That’s a big proportion of people who prefer watching videos to get a resolution to their problem.
The reason behind people’s preference for video content can be that watching videos takes less effort and time to consume the information and the explanatory power of videos is much higher than textual content.
So must create video content to tap this bigger proportion of the audience otherwise your competitors will.
6. GIFs
As I told you before, GIF stands for Graphics Interchange Format. In simple words, you can call them animated pictures or moving pictures.
GIFs help one to express feelings and emotions for a thing or situation in a better way compared to images.
But a GIF is different from a gifographic, a GIF can be a moving picture of a person, while a gifographic is made up of only moving graphics.

You might have seen GIFs on social media, from individuals to big companies, everybody makes use of GIFs to interact with others.
And you should also use GIFs in your content to:
- Increase engagement
- Increase personalization
- Explain information better
- Make the content more contextual
- Grab people’s attention
- Lessen boredom
- Keep people reading your content
How to create a GIF? Well, there are unlimited GIFs available on the internet, but I will suggest you create a GIF using original or stock media to avoid copyright issues. You can easily create one for your content or article with free online GIF creators like ezgif.com or gifmaker.me, they are easy to use.
7. Screenshots
Screenshots, also known as screen capture or screengrab, are a feature through which we can capture a smartphone or computer screen. And almost every smartphone or PC consists of this feature as default.
Screenshots prove highly beneficial for explaining things and processes, facilitating easy reference to visual elements, enhancing comprehension beyond text.
For example: If you’re a Software as a service (SaaS) provider, and you have added a new feature to your product and would like to explain and announce the feature to your clients, screenshots can be very useful. In such a case, instead of using only text, you should use screenshots of the software referencing the feature, and you can also use them to explain the step-by-step process for using the feature.
If you have noticed, I have used screenshots in this article as well. In the 5th point – Videos, I took a screenshot of Ahrefs blog to show you how they use videos in their blog.
So, screenshots can be really useful when it comes to explaining and showing things.
How to take screenshots?
In windows, you can take a full screenshot by tapping on the ‘print screen button’ on the keyboard. And for the partial screenshots, you can use the ‘screen snip’ or ‘snipping tool’ program.
In Mac, press ‘Shift+Command+3’ to capture a full screenshot, and ‘Shift+Command+4’ to capture a portion of the screen.
In smartphones, mostly it requires pressing the ‘volume up/down + power button’ together to take a screenshot or it may vary depending on your smartphone brand.
8. Quote Cards
Have you ever used someone’s quote in your content before? If not, then you definitely should.
A quote card is an image specifically designed to share someone’s quote, like in the image below.

Spoken proverbs in movies or TV shows are also considered quote cards, and they are also known as macros. You should use them to express things better and to drive engagement.

Quote cards may seem like memes but they’re different. You can’t manipulate quotes while creating a quote card but you can while creating memes.
9. CTAs
What is content marketing? Creating useful and engaging content to build an audience and to drive ‘profitable customer action’ through it. If your audience is not taking action that can benefit your business, then you’re doing something wrong.
Maybe you’re not using CTAs. Call to Action (CTA) is a marketing tool used to persuade people to take action or give an immediate response.
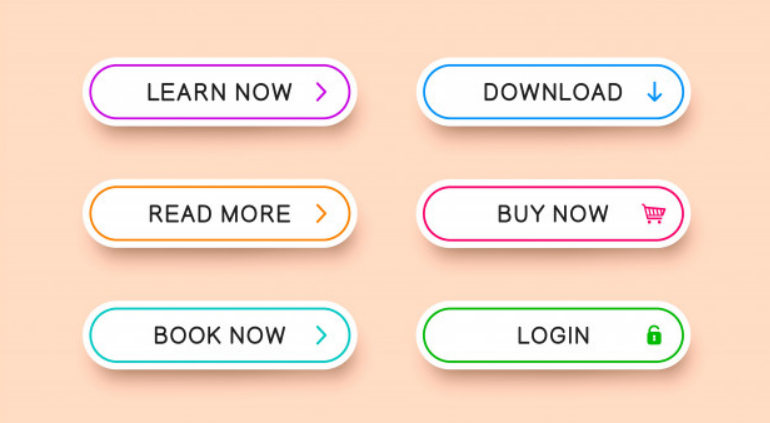
A CTA can be:
- A button (like in the above image)
- A text hyperlink
- A text with no hyperlink
For example, if you run an e-commerce website, your CTA can be an attractive button with text – “Avail 50% Discount”.
Visuals and buttons get the most conversions. According to Brafton’s study, revenue increased by 83% after they added the CTA button to article templates.
Regardless of how better your content is, don’t forget to add CTAs.
10. Embed Social Media Posts
Embedding relevant social media posts to your content can enhance it. You can show your audience what people think about something and what you think about it.
Embedding social media posts can add authenticity and credibility to your content. They can make users feel that you’re authentic and not using content to entice them.
Sometimes, it may lead to writing a dedicated article when a social media discovery sparks interest in a relevant topic. In such a case, embedding social media content can be very helpful.
In this post, we mentioned many times that “visuals can increase engagement.” So it’s worth a while to discuss the scientific reasons behind this increased engagement.
Why Do Visuals Increase Engagement?
You might have heard this saying – “A picture is worth 1000 words.” Seems true indeed if we look at these stats:
- On Facebook, posts with images attract 53 percent more “Likes,” 104 percent more comments, and 84 percent more click-throughs.
- Adding a photo URL to a tweet can boost retweets by an impressive 35%.
It seems visuals captivate attention, significantly boosting social media engagement, making compelling imagery crucial for effective online communication and interaction.
Now, let’s discuss four scientifically proven reasons behind the increase in engagement created by visuals.
1. Half of the human brain is devoted to vision.
As per MIT research – Brain Processing of Visual Information, our brains (which were previously thought to process only simple visual information) can also process complex visuals such as optical illusions.
Professor Mriganka Sur of MIT’s Department of Brain and Cognitive Sciences (who conducted the research) said, “Because half of the human brain is devoted directly or indirectly to vision, understanding the process of vision provides clues to understanding fundamental operations in the brain.”

Talking of facts, 70% of sensory receptors are in our eyes, due to which we only take 150 milliseconds to recognize a symbol + 100 milliseconds to attach a meaning to it.
So, visuals can quickly grab our attention. That’s why traffic signs are mostly made up of symbols rather than text.
2. We are attracted to colors.
Research has shown that people make a subconscious judgment within 90 seconds of initially seeing an image, and 62 to 90 percent of that judgment is based on color alone.
Colors can even influence consumer’s perception of a brand, which makes it important for content marketers to use visuals and understand color psychology.
It is believed that every color broadly represents some specific traits. For example, brown represents ruggedness, blue represents safety, purple represents sophistication, and red aligns with excitement.
But, as a marketer, you shouldn’t choose colors based on these broad statements. For example, if you think “yellow” is irrelevant for your content, have a look at the stats below:
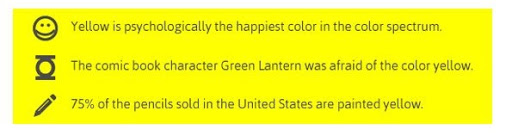
So, along with driving engagement, colors can also help you in driving people’s response to your content.
3. We respond to faces.
A group of researchers in the US discovered that neurons in our brain become highly active and responsive when we see a human face. While these neurons are less and less responsive when we don’t see a human face.

Furthermore, the study indicated that a neat circuit between these neurons and another area of the brain known as the “Amygdala” is activated whenever we see facial expressions. This can be also important to understand why we recognize our friends and family from afar.
So using a related human stock image enhances attention, conveying content effectively and visually, capturing interest with compelling imagery.
4. We remember what we see.
When it comes to remembering things, the Picture Superiority Effect comes into play. It refers to the phenomenon in which people are more likely to remember pictures and images than words.
You must have noticed that whenever you try to remember something, a picture always comes to your mind. That’s why pictures are more memorable, have a look at the stats below:
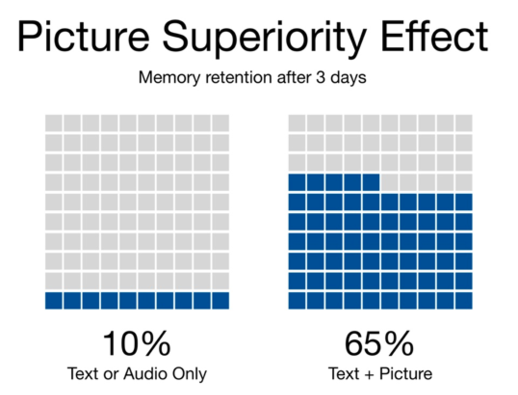
As per Huffspot, after 3 days, people remember 65% of content if it contains text + picture, while they remember only 10% of content if they see text or audio-only content.
That’s why infographics have become so popular, and marketers should definitely try to explain the content using visuals rather than only text.
Bottom Line
The current scenario underscores the challenge of engaging content; sustained reader interest necessitates integrating visuals for effective communication.
The time when people used to read text-only content is long gone.If visual content is not utilized, users lose interest and abandon text, regardless of its utility
That’s why visual content has become the primary focus of content marketers, it is the new basis of competition between content marketers. Visual content seems to be the only way through which your content can stand out from the competition.
So, you can’t and shouldn’t turn your back on creating and using visual content if you want to achieve your content marketing goals.